
Page 11 - december 2022 Nai Udaan
P. 11
Implementation
Backend
Feature Engineering: Using Spearman and Pearson correlation operators on our datasets we concluded
that pressure, humidity, wind direction, wind speed and the radial distance to solar noon are
correlated to the amount of electrical power generated
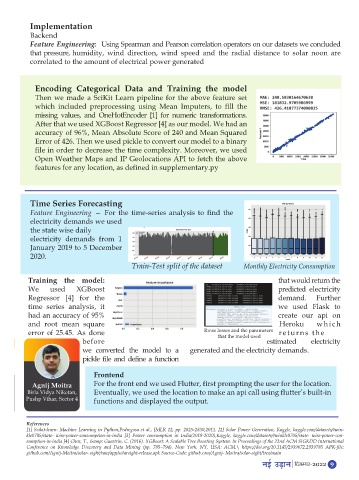
Encoding Categorical Data and Training the model
Then we made a SciKit Learn pipeline for the above feature set
which included preprocessing using Mean Imputers, to fill the
missing values, and OneHotEncoder [1] for numeric transformations.
After that we used XGBoost Regressor [4] as our model. We had an
accuracy of 96%, Mean Absolute Score of 240 and Mean Squared
Error of 426. Then we used pickle to convert our model to a binary
file in order to decrease the time complexity. Moreover, we used
Open Weather Maps and IP Geolocations API to fetch the above
features for any location, as defined in supplementary.py
Time Series Forecasting
Feature Engineering — For the time-series analysis to find the
electricity demands we used
the state wise daily
electricity demands from 1
January 2019 to 5 December
2020.
Train-Test split of the dataset Monthly Electricity Consumption
Training the model: that would return the
We used XGBoost predicted electricity
Regressor [4] for the demand. Further
time series analysis, it we used Flask to
had an accuracy of 95% create our api on
and root mean square Heroku which
error of 25.45. As done Rmse losses and the parameters returns the
that the model used
before estimated electricity
we converted the model to a
generated and the electricity demands.
pickle file and define a function
Frontend
Agnij Moitra For the front end we used Flutter, first prompting the user for the location.
Birla Vidya Niketan, Eventually, we used the location to make an api call using flutter’s built-in
Pushp Vihar, Sector 4 functions and displayed the output.
References
[1] Scikit-learn: Machine Learning in Python,Pedregosa et al., JMLR 12, pp. 2825-2830,2011. [2] Solar Power Generation, Kaggle, kaggle.com/datasets/twin-
kle0705/state- wise-power-consumption-in-india [3] Power consumption in India(2019-2020),Kaggle, kaggle.com/datasets/twinkle0705/state- wise-power-con-
sumption-in-india [4] Chen, T., & Guestrin, C. (2016). XGBoost: A Scalable Tree Boosting System. In Proceedings of the 22nd ACM SIGKDD International
Conference on Knowledge Discovery and Data Mining (pp. 785–794). New York, NY, USA: ACM.\ https://doi.org/10.1145/2939672.2939785 APK-file:
github.com/Agnij-Moitra/solar- sight/raw/app/solarsight-release.apk Source-Code: github.com/Agnij- Moitra/solar-sight/tree/main
xÉ<Ç =cÉxÉ fnlEcj&2022 9