
Page 32 - nai udaan december
P. 32
(C) Spectrophotometric determination of photometer.
phenolic content in tea extracts (D) Thin layer chromatography
- Prepare the standard curve using 10 µl of known - A fixed amount of (5 µl) of each tea extract was taken
amounts (0-50 µg) of Gallic acid. and spotted in a TLC sheet and air dried in room
- Added 10 µl each of unknown tea sample extract to temperature
an appropriately labelled test tube (in triplicates). - TLC plate was kept in a beaker containing ca. 100 ml
- Added 1.25 ml of Folin&Ciocalteu’s reagent and 1 solvent [ petroleum ether: ethyl acetate (7:3)]
ml sodium carbonate to each tube and mixed well. - Setup kept aside for separation for 30 minutes
- Incubated at room temperature for at 1 hour and - TLC sheet was taken out and the bands were
absorbance measured at 765 nm in a UV-VIS Spectro- visualized
4. Observation & Results (B) Spectrophotometer determination of gallic
acid standard
(A) Antimicrobial activity of methanol extract
of different tea samples
(C) Estimation of total phenolic content in tea extract
CONCLUSION: Fresh tea leaves extract exhibited greater antimicrobial activity, CONCLUSION: Fresh tea leaves have the highest accumulation of
as evident by larger zones of inhibition against the tested bacteria followed by green tea. total phenolic content followed by Green tea.
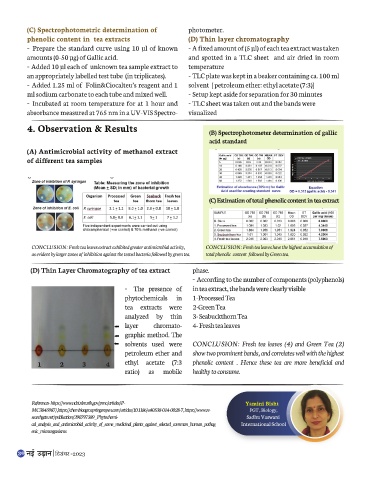
(D) Thin Layer Chromatography of tea extract phase.
- According to the number of components (polyphenols)
- The presence of in tea extract, the bands were clearly visible
phytochemicals in 1-Processed Tea
tea extracts were 2-Green Tea
analyzed by thin 3- Seabuckthorn Tea
layer chromato- 4- Fresh tea leaves
graphic method. The
solvents used were CONCLUSION: Fresh tea leaves (4) and Green Tea (2)
petroleum ether and show two prominent bands, and correlates well with the highest
� 1 � 2 3 4 ethyl acetate (7:3 phenolic content . Hence these tea are more beneficial and
ratio) as mobile healthy to consume.
References- https://www.ncbi.nlm.nih.gov/pmc/articles/P- Yamini Bisht
MC3845987/,https://chembioagro.springeropen.com/articles/10.1186/s40538-014-0028-7, https://www.re- PGT , Biology,
searchgate.net/publication/290797389_Phytochemi- Sadhu Vaswani
cal_analysis_and_antimicrobial_activity_of_some_medicinal_plants_against_selected_common_human_pathog International School
enic_microorganisms
�
30 xÉ<Ç =cÉxÉ fnlacj -2023
�